
A practical evidence and health-economic framework for measuring pathway change, released clinical capacity, performance-based payment and value capture.
29 September 2026
1. The economic question has been framed too narrowly
The familiar formulation is compelling: what happens when a healthcare system pays for activity, while an innovation creates value by avoiding activity? In the German DiGA debate, that question is directionally useful — but it is not quite precise enough. German ambulatory payment is not a pure fee-for-service system, and an avoided visit does not automatically become a cash saving. The more durable question is whether the unit that is reimbursed matches the unit in which value is created. [8][9][16]
For many digital interventions, the reimbursed object is the DiGA. The economic consequence, however, may appear elsewhere: fewer routine contacts, a different mix of referrals, faster escalation for high-risk patients, reduced administrative work, greater self-management, or released clinical capacity. Those effects can fall into different budgets and may benefit different actors. The DiGA is therefore a product, but its value can be a property of the pathway. [7][8][15]
| A better framingThe central mismatch is product-level assessment versus pathway-level value creation. “Less care” is only one possible outcome. The more important objective may be better allocation of scarce care. |
Table 1. Four economically different meanings of “reduced healthcare activity”
| What changes | Economic meaning | What not to assume | What to measure |
| A service genuinely disappears | Cash-releasing substitution | Do not assume every avoided contact releases cash | Avoided claims, contracts, consumables, overtime, external spend |
| A clinician slot is freed and reused | Capacity release / opportunity-cost value | Do not call fixed payroll a cash saving | Net clinician minutes, slots released, waiting time, destination of capacity |
| Routine work falls but complex care rises | Care reallocation | Do not judge value by lower activity alone | Case mix, acuity, downstream outcomes, high-value activity enabled |
| Monitoring finds problems earlier | Appropriate induced activity | Do not treat all extra utilisation as failure | Escalations, diagnoses, admissions prevented later, health gain and safety |
This distinction matters because “cost saving” and “economic value” are not synonyms. A DiGA may increase expenditure and still be cost-effective; it may release capacity without reducing the provider’s budget; or it may increase appropriate care in the short term by identifying patients who need escalation. A rigorous value case starts by naming which of these mechanisms is expected rather than putting every resource change into a single savings bucket. [14][15]
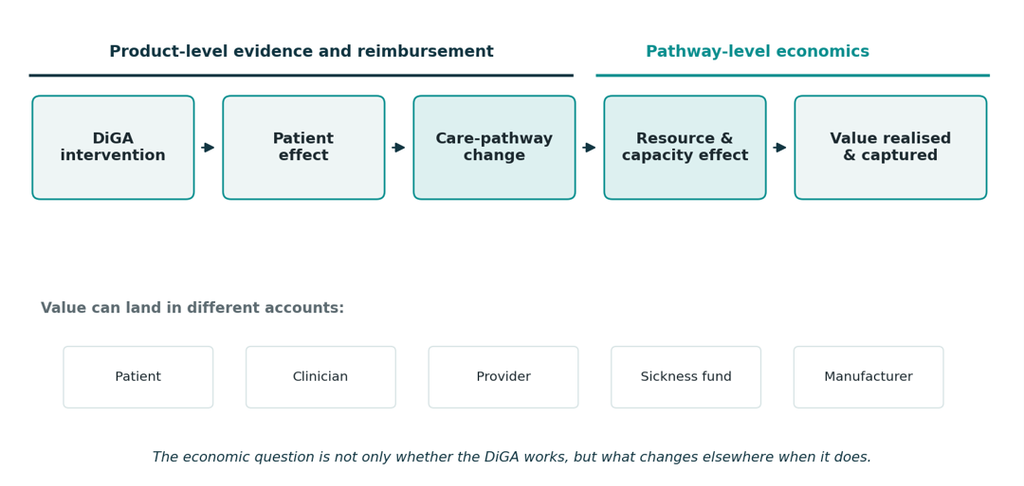
Figure 1. The Odelle pathway-value chain
Source: Odelle Technology synthesis based on Gensorowsky et al. [7], Benning et al. [8], Freitag et al. [9] and Kidholm et al. [15].
2. What Germany actually pays for and what changed in 2026
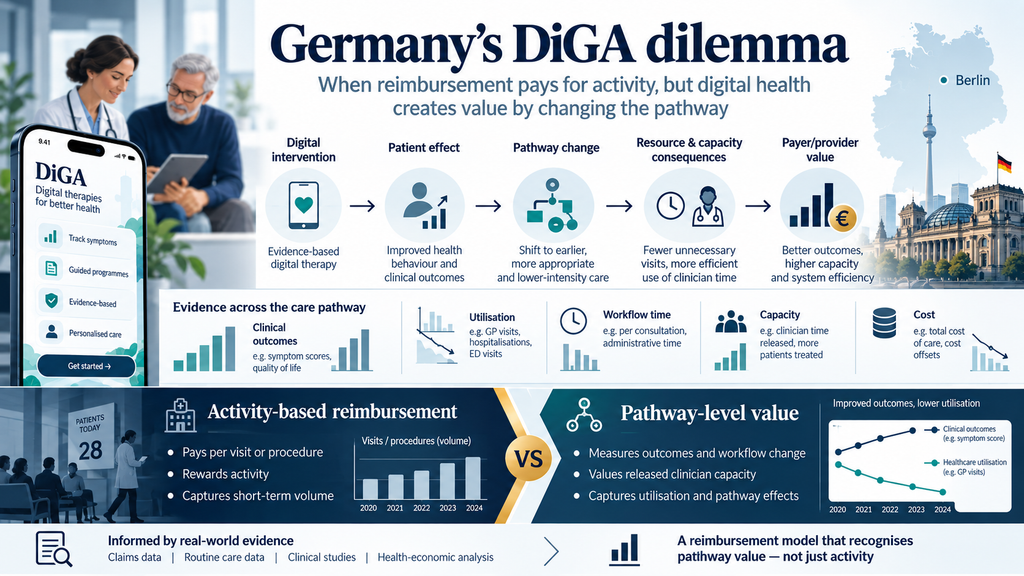
The DiGA fast track separates several decisions that are easy to conflate. For inclusion in the BfArM directory, a manufacturer must demonstrate the relevant compliance requirements and a positive healthcare effect. Under §139e SGB V, that effect is either a medical benefit or a patient-relevant structural and process improvement. The reimbursement amount is then governed separately under §134 SGB V. This is not the same architecture as a conventional cost-effectiveness appraisal that estimates an incremental cost per health outcome before access. [1][2][3][7]
That separation has always created a health-economic question: a technology may generate clinically meaningful benefit, pathway change and resource consequences, but those elements do not automatically arrive in one integrated valuation. Gensorowsky and colleagues highlighted the absence of a standard method for translating patient-relevant DiGA benefit into monetary value and proposed a value-based pricing approach anchored to established reimbursed care. [7]
2026 makes the question more urgent
From 1 January 2026, §134 SGB V requires at least 20% of the negotiated DiGA reimbursement amount to be success-dependent. Germany has therefore moved beyond a purely fixed negotiated amount. In parallel, application-accompanying success measurement (AbEM) has entered operational use: BfArM states that manufacturers of permanently listed DiGA must collect Q3/Q4 2026 data from 1 July 2026, with first reporting of usage metrics due by 15 April 2027. [3][4][5]
The statutory AbEM core is important: use duration and frequency, discontinuation, patient satisfaction, and patient-reported health status. Yet those measures do not, by themselves, quantify clinician time, avoided referrals, diagnostic substitution, downstream service use, waiting-list effects, total pathway cost or the destination of released capacity. Manufacturers that want to make a system-value argument will therefore need an economic evidence layer in addition to the statutory success-measurement layer. [1][4][5]
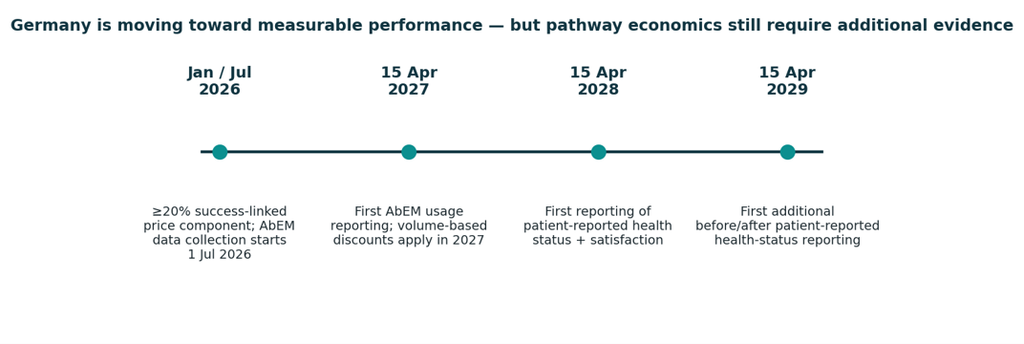
Figure 2. The 2026–2029 DiGA performance-measurement timeline
Source: Odelle Technology redraw from §134 and §139e SGB V, DiGAV §§23a–23e, and BfArM implementation information [1,3–5].
Table 2. What the statutory success measurement captures — and what a pathway-value study should add
| Evidence layer | Core measures | Economic question answered |
| Statutory AbEM | Usage duration/frequency; discontinuation; patient satisfaction; patient-reported health status | Is the DiGA used, completed and associated with patient-reported success? |
| Pathway utilisation | Visits, referrals, diagnostics, therapy, medication, admissions, escalation | What healthcare activity actually changes? |
| Workforce / workflow | Onboarding, review, alerts, documentation, exception handling, training | Does the DiGA release or consume scarce professional time? |
| Capacity | Slots/hours released; waiting time; new patients treated; higher-acuity work enabled | Where does released capacity go? |
| Economic model | DiGA price, implementation cost, downstream cost, budget impact, QALYs/outcomes | Is the pathway affordable and cost-effective from the chosen perspective? |
3. The academic evidence points to a measurement gap
3.1 DiGA evidence has overwhelmingly concentrated on medical benefit
The strongest recent synthesis is the 2025 systematic review by Sippli and colleagues. Across 23 published DiGA approval studies, the authors identified 29 primary outcomes. They classified 28 as medical-benefit outcomes — 25 improvement-of-health outcomes and three quality-of-life outcomes — and only one as a patient-relevant structural/process improvement (patient autonomy). The authors also reported high overall risk of bias across the included studies, particularly for outcome measurement and missing data. [13]
Mäder and colleagues had already observed the same direction in 2023: among the permanently listed DiGA they assessed at that time, positive healthcare effects were demonstrated through medical benefit rather than patient-relevant structural or process improvement. This matters because digital health is often claimed to transform coordination, access, self-management and workflow — precisely the domains that are less visible if the evidence programme is built primarily around conventional clinical endpoints. [12][13]
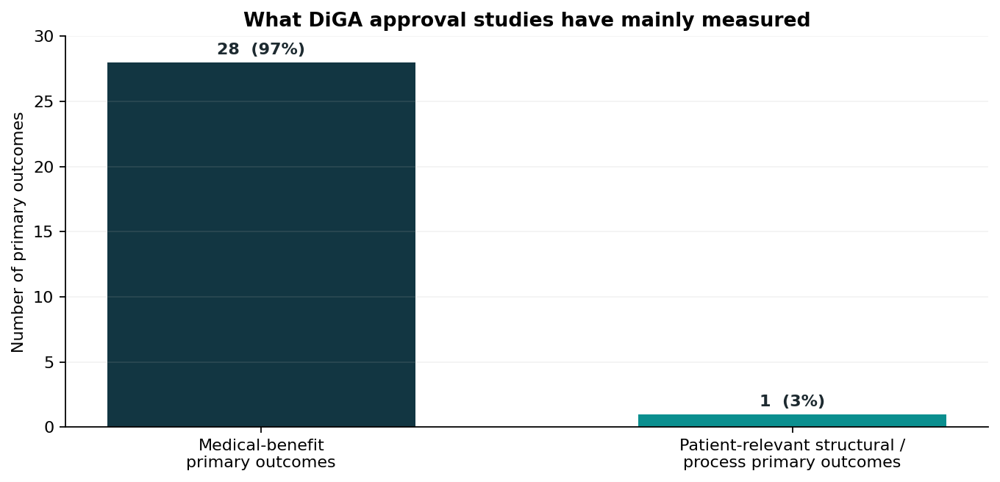
Figure 3. Primary outcomes in the 2025 systematic review of DiGA approval studies
Source: Odelle Technology chart from Sippli et al. 2025 [13]. Outcome classification was performed by the review authors. N=29 primary outcomes across 23 approval studies.
3.2 The adoption actor bears real implementation costs
The physician is not simply a neutral distribution channel. In a 2024 survey of 100 German internal-medicine physicians, 31% had prescribed a DiGA and 29% had tested one; self-rated knowledge was low. The most frequently reported barrier was lack of knowledge about effective implementation (60%), followed by lack of time for patient onboarding (27%) and concern about adherence (21%). [10]
A separate qualitative study based on 46 physician interviews found that integration of digital therapeutics changes responsibilities and workflows and requires time, trustworthy effectiveness information and practical experience. Together, these studies support a straightforward economic proposition: adoption has a transaction cost, and that cost should be measured if clinicians are essential to realising the downstream value. [11]
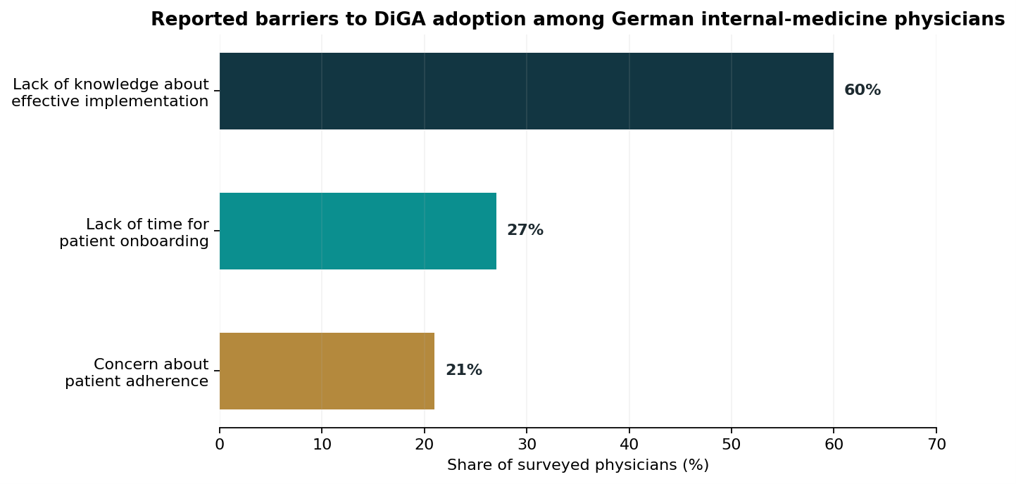
Figure 4. Physician-reported barriers are partly workflow and capability problems
Source: Odelle Technology chart from Cirkel et al. 2024 [10]. Survey n=100 at the 2024 German Society for Internal Medicine congress.
3.3 Cost-effectiveness is not the same as cost saving
Freitag and colleagues’ 2024 Markov cohort analysis of depression DiGA is useful precisely because it resists an easy savings narrative. In the authors’ base-case future scenario, wider DiGA use generated approximately 0.02 additional QALYs per patient over five years but added about €1,536 in direct costs per patient compared with care without DiGA. Under the study assumptions and threshold used, the scenario was not cost-effective in the base case. The result is not a verdict on all DiGA; it is a demonstration that clinical benefit, access benefit, cost-effectiveness and budget saving are different claims and require different evidence. [14]
Table 3. One published example: five-year depression DiGA model (not generalisable to all DiGA)
| Scenario | Direct cost / patient | QALYs / patient | ICER vs no DiGA | Interpretation in the study |
| Without DiGA | €7,933 | 2.16478 | Comparator | Lowest base-case direct cost |
| DiGA at then-current use | €7,980 | 2.16538 | €79,466/QALY | Small incremental effect and cost |
| Future scenario: 50% DiGA use | €9,469 | 2.18367 | €81,335/QALY | ~0.02 QALY gain; +€1,536 direct cost per patient |
Source: Freitag et al. 2024 [14]. Values reproduce the authors’ deterministic base-case table; the model perspective, inputs and willingness-to-pay assumptions determine interpretation.
3.4 Scarce clinician time has an opportunity cost that payroll can miss
A particularly important methodological development appeared in September 2026. Kidholm, Johansson and Poulsen argue that economic evaluation of digital technologies should systematically measure Time Needed to Treat (TNT) and, where workforce shortages make clinical time scarce, consider shadow prices rather than treating payroll cost as the whole opportunity cost. They also emphasise the counterpoint: digital technologies can consume time through training, false positives, parallel processes and documentation as well as release it. [15]
| The practical implicationMeasure net professional time, not assumed time. A digital intervention should get credit for capacity only after subtracting onboarding, review, alert handling, documentation, training and other new workflow burdens. |
4. This is now a system-scale economic issue
DiGA are no longer a small reimbursement experiment. The GKV-Spitzenverband’s 2025 statutory report, based on claims data from the sickness funds, records about 1.6 million redeemed activation codes from the start of the programme through the end of 2025 and cumulative GKV expenditure of €401.1 million. The report also shows rapid year-on-year growth. These are payer-reported figures and the GKV-Spitzenverband’s policy interpretations should be read as the payer association’s perspective; the utilisation and expenditure data nonetheless show the scale of the market. [6]
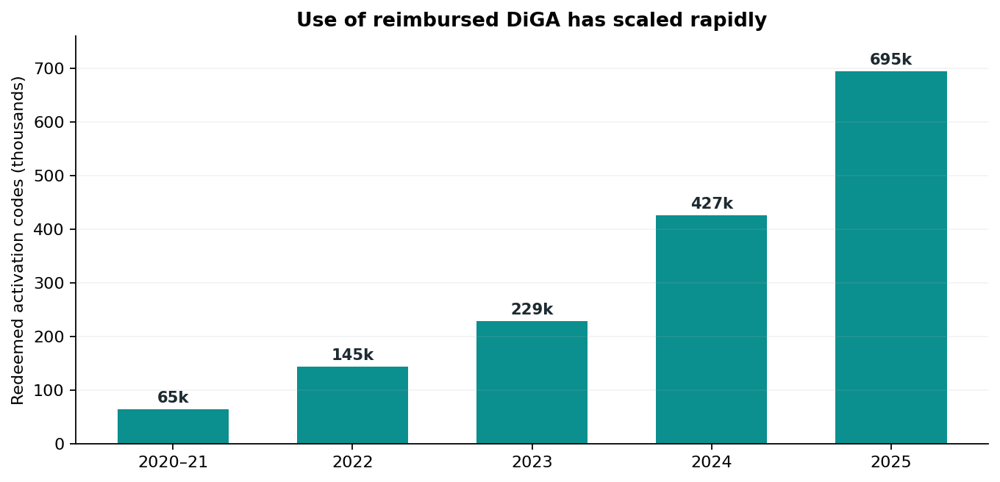
Figure 5. Redeemed DiGA activation codes, 2020–2025
Source: Odelle Technology chart from GKV-Spitzenverband DiGA-Bericht 2025 [6]. “2020–21” is the cumulative total through end-2021; later bars are annual totals.
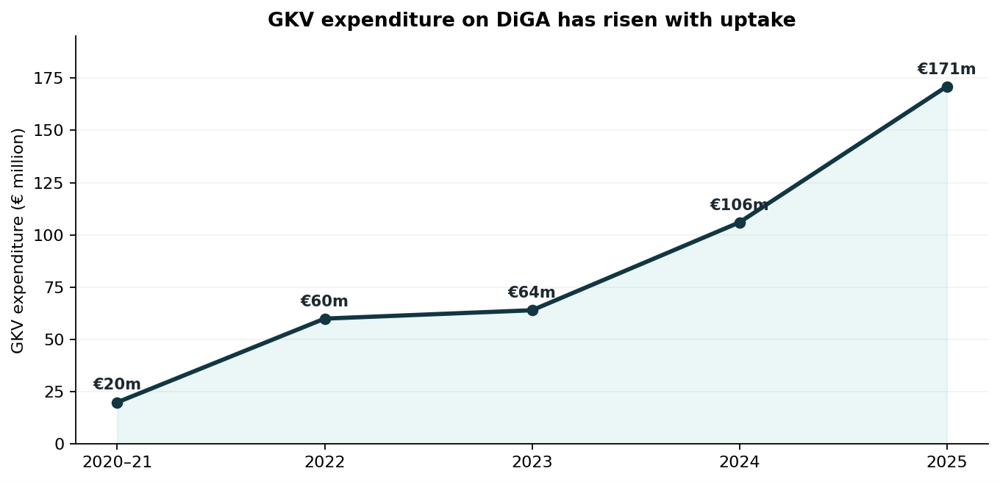
Figure 6. GKV expenditure on DiGA, 2020–2025
Source: Odelle Technology chart from GKV-Spitzenverband DiGA-Bericht 2025 [6]. “2020–21” covers expenditure from programme start in 2020 through end-2021.
Price negotiation is equally material. For DiGA for which negotiated amounts had been established, the GKV report compared an average prior manufacturer price of €552 with an average negotiated price of €227 — an average reduction of about 59% for that set. The report also gives €566 as the average current manufacturer price across listed DiGA at 31 December 2025. The important strategic point is not to treat any one of these averages as a value benchmark; it is that a manufacturer needs an evidence case capable of surviving a negotiation in which list price and negotiated reimbursement can diverge substantially. [6]
Table 4. Reported negotiated-price gap in the 2025 GKV-SV report
| Reported price measure | Average amount | Interpretation |
| Prior manufacturer price for the negotiated set | €552 | Pre-negotiation reference for the set analysed by GKV-SV |
| Negotiated reimbursement amount | €227 | About 59% lower on average for that negotiated set |
Source: GKV-Spitzenverband DiGA-Bericht 2025 [6]. These averages describe the set reported by GKV-SV and should not be interpreted as a universal benchmark for DiGA value.
5. The structural mismatch: who does the work, who carries the budget, who captures the value?
The same DiGA can be highly valuable in one account and costly in another. A patient may gain autonomy and symptom control. A physician may gain capacity — or lose time to onboarding and alerts. A provider may improve throughput. A sickness fund may avoid some downstream claims. The manufacturer receives the DiGA reimbursement. An employer or family caregiver may capture benefits that never appear in the statutory payer’s budget. A credible value analysis therefore needs a value-capture map as well as a clinical effect estimate. [8][9][15]
Table 5. A value-capture map for DiGA
| Actor | Value potentially created | Cost / friction potentially incurred | Evidence to collect |
| Patient | Health, autonomy, convenience, access, lower treatment burden | Time, digital burden, adherence effort, privacy concerns | PROMs, outcomes, time, satisfaction, access |
| Clinician | Better information; fewer routine contacts; capacity for complex care | Onboarding, review, alerts, documentation, training | Minutes per task, alert volume, contacts, case mix |
| Provider organisation | Throughput, waiting-time reduction, workflow standardisation | Integration, IT, change management, parallel processes | Capacity, waiting time, staffing, implementation cost |
| Sickness fund / GKV | Avoided reimbursed activity; improved outcomes; prevention | DiGA reimbursement; induced care | Claims, total pathway cost, budget impact, outcomes |
| Manufacturer | Reimbursement and scale | Evidence generation, support, performance risk | Activation, completion, outcomes, contract metrics |
| Society / employer | Productivity, informal-care effects, access | Broader implementation costs | Absence, productivity, caregiver time where relevant |
This is why “physicians lose money if activity disappears” is too crude as a general proposition. In some settings the activity is not paid marginally; in others capacity is immediately reused; and for specific DiGA-related activities the EBM can provide additional remuneration. KBV states that initial DiGA prescribing is included in basic/insured-person lump sums, while defined follow-up, evaluation or individualisation activities can receive additional payment. For example, Kranus Mictera received a specific €8.15 EBM add-on from April 2026 for defined follow-up/evaluation activity. That compensates an activity; it is not the same thing as sharing the pathway value generated downstream. [16][17]
6. How to build a DiGA pathway-value evidence strategy
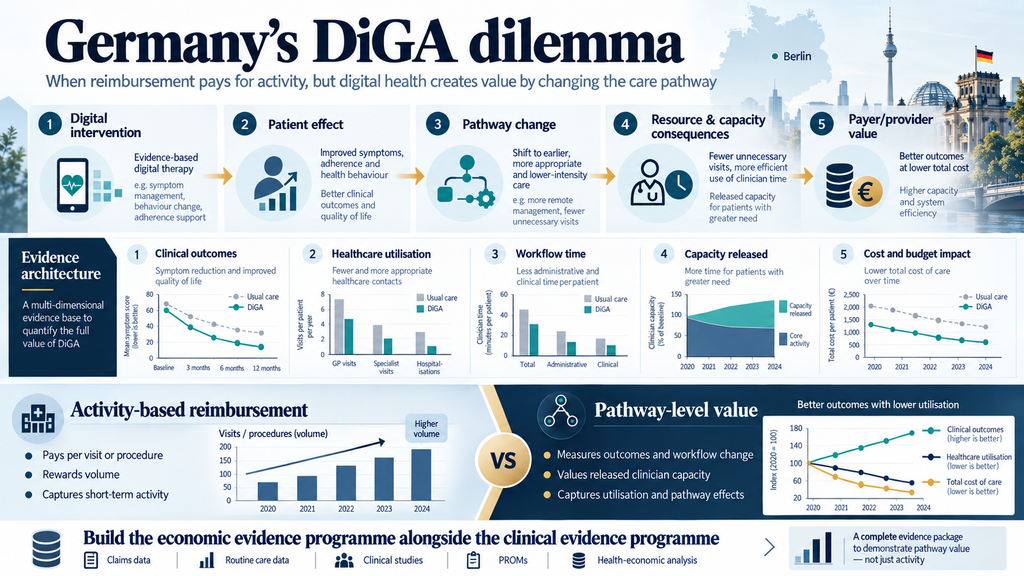
The practical answer is to design the economic evidence programme at the same time as the clinical evidence programme. The manufacturer should be able to trace a causal chain from the product to a patient effect, from the patient effect to a pathway change, from the pathway change to resource and capacity consequences, and from those consequences to a payer/provider value proposition. The steps below turn that principle into an operational plan.
| 1 | Map the counterfactual pathway before choosing economic endpoints Document usual care in enough detail to identify what the DiGA can plausibly change: contacts, tests, therapies, referrals, monitoring, documentation, escalation and waiting. Record who performs each task, how often, and which budget pays for it. The comparator must be a real pathway, not an abstract “standard care” label. [7][14] |
| 2 | State the mechanism of value explicitly Classify the DiGA as add-on, substitution, triage, monitoring, self-management, coordination or a combination. For every claimed benefit, specify the intermediate pathway event that must change. If there is no causal bridge from the app to resource use, the economic claim is fragile. |
| 3 | Build two evidence layers Layer A should satisfy the positive-healthcare-effect claim: clinical or patient-relevant outcomes. Layer B should measure pathway and economic consequences: utilisation, workflow, capacity and cost. Do not expect the clinical endpoint to carry the entire reimbursement argument. [1][7][13] |
| 4 | Measure Time Needed to Treat including the new work Collect onboarding time, clinical review time, alert/exception handling, documentation, training and support as well as time avoided. Use time-and-motion methods, system logs or structured workflow sampling. Report net minutes, not only gross minutes “saved”. [15] |
| 5 | Classify every resource effect before monetising it Tag each effect as cash-releasing, capacity-releasing, shifted activity or appropriate induced activity. Apply monetary values only where the costing method matches the mechanism. If a fixed salaried clinician is redeployed, report capacity first; do not automatically book salary as a saving. |
| 6 | Show where released capacity goes If the technology frees 1,000 appointments, follow the appointments. Are they unused, filled by waiting-list patients, converted to longer complex consultations, or absorbed by other work? Capacity is valuable when its destination is visible. |
| 7 | Choose the economic model to match the claim Use cost-consequence analysis when multiple outcomes and pathway effects matter; budget-impact analysis for affordability; cost-utility analysis when incremental health outcomes such as QALYs are central; and scenario/sensitivity analysis for uncertainty in uptake, time release and substitution. A single model rarely answers every decision-maker’s question. [7][14] |
| 8 | Build the real-world data architecture before launch Predefine the linkage between DiGA logs, PROMs, physician/provider workflow data, claims/EHR data and implementation measures. Specify attribution, comparator, time horizon, missing-data handling and subgroup analysis. Treat AbEM as one layer of the dataset, not the whole economic evidence strategy. [4][5][13] |
| 9 | Design performance metrics that can support a contract. A good metric should be observable, attributable, auditable, clinically meaningful, and difficult to game. Usage alone is not effectiveness. Where outcomes depend partly on payer/provider process access, onboarding, referral or follow-up consider shared accountability rather than placing all performance risk on one party. [8][9] |
| 10 | Re-estimate value after implementation Update utilisation rates, workflow times, downstream resource use and outcomes as real-world data accumulate. A pathway model should become a living model: the value proposition should change when care patterns, prices, clinical practice or uptake change. |
7. A minimum viable pathway-value dataset
For most DiGA manufacturers, the most useful practical question is: what data should we collect that we are not already collecting? The table below is a compact starting specification. It is deliberately broader than the statutory success measures because the objective is not only to show that the DiGA is used, but to show what it changes.
Table 6. Minimum viable dataset for a pathway-value study
| Domain | Minimum variables | Possible data source | Decision use |
| Patient outcome | Primary clinical/PROM endpoint; safety; quality of life; treatment burden | Trial, DiGA PROM, EHR | Positive healthcare effect; cost-utility |
| Engagement | Activation; frequency; duration; completion; discontinuation | DiGA logs / AbEM | Real-world use; performance metric |
| Clinician time | Onboarding; review; alerts; documentation; exception handling | Time study, logs, clinician sample | Net TNT; implementation burden; capacity |
| Healthcare utilisation | GP/specialist contacts; diagnostics; therapy; medication; admission; escalation | Claims/EHR/provider data | Substitution; induced activity; budget impact |
| Access / capacity | Waiting time; time to treatment; slots released; new patients managed | Scheduling/provider data | Opportunity-cost value; service productivity |
| Implementation cost | Integration, training, support, change management | Provider/manufacturer records | Full pathway cost |
| Distribution | Age, sex, severity, comorbidity, geography, digital access | Trial/RWE/claims | Case mix; equity; generalisability |
| Value destination | Where released resources are redeployed | Provider audit / interviews / scheduling | Distinguish savings from capacity |
8. How to value clinician capacity without pretending it is cash
The most common digital-health economic error is to multiply avoided clinician minutes by a wage rate and label the result “savings”. That can be legitimate in some circumstances — for example when overtime, locum, external-contract or variable staffing expenditure genuinely falls — but it is not automatically correct when staffing is fixed. In a capacity-constrained service, the better primary result may be hours or appointment slots released, followed by a transparent valuation of their opportunity cost. [15]
| A useful calculationNet clinician time released = time avoided − onboarding − review − alerts/exception handling − documentation − training allocated per patient. Report the result first in minutes/hours. Monetise it only with an explicit costing or shadow-pricing rule. |
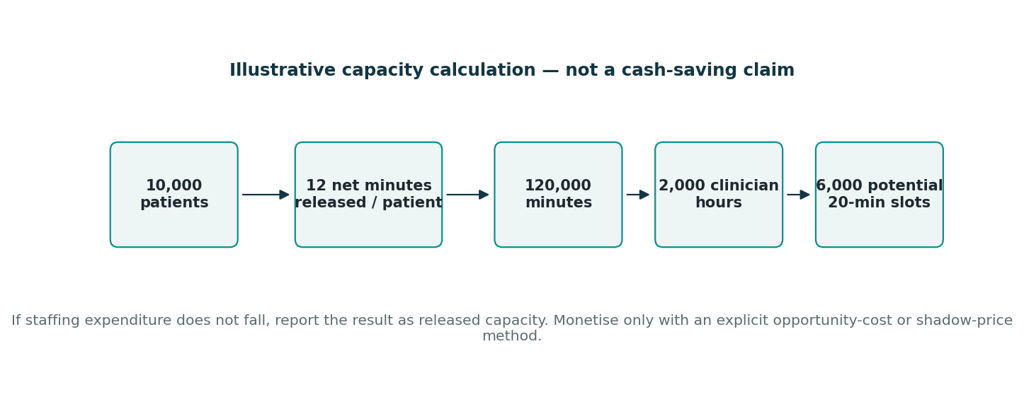
Figure 7. Worked example: converting time into capacity without overstating savings
Source: Odelle Technology illustrative calculation. 10,000 × 12 net minutes = 120,000 minutes = 2,000 hours = 6,000 20-minute slots. This is not empirical DiGA data.
That result can then be translated into scenarios. If the released slots are filled by patients who would otherwise wait, the primary benefit may be access and throughput. If they replace agency/overtime expenditure, some value may become cash releasing. If they allow longer visits for high-acuity patients, the value may be quality and risk management rather than volume. The model should make those scenarios explicit instead of collapsing them into one euro number. [15]
9. How to design a performance-based reimbursement model that does not reward the wrong thing
Germany’s statutory ≥20% success-dependent component creates a real design problem: success has to be defined. Benning and colleagues propose an intervention-specific framework with shared accountability between manufacturers and payers. Freitag and colleagues’ stakeholder work found support for value-based approaches, while also showing the appeal — and limitations — of usage-based payment. The central lesson is that the easiest metric to measure is not necessarily the right metric to pay on. [8][9]
Table 7. Performance metric design: tempting measures and stronger alternatives
| Tempting metric | Why it can mislead | Stronger design |
| Prescription count | Measures adoption, not activation or benefit | Activation + eligible population + outcome |
| Logins / usage time | High use can mean engagement, difficulty or inefficiency; usage ≠ effectiveness | Completion/engagement paired with patient outcome |
| Total physician visits | May penalise clinically appropriate escalation | Predefine avoidable routine activity + safety/escalation rules |
| PROM improvement only | Captures patient value but not pathway economics | PROM + resource/workflow measure where system-value claim is made |
| One-sided outcome guarantee | Outcome may depend on access, onboarding or provider process outside manufacturer control | Shared process + outcome obligations; case-mix rules |
| Raw cost reduction | Can reward under-use or ignore health gain | Net value framework: outcome, safety, resource use and uncertainty |
A practical contract architecture
Define the eligible population and baseline before outcomes are observed.
Use at least one patient-relevant outcome metric and, where system value is claimed, one pathway/resource metric.
Specify the observation window, missing-data rule, discontinuation rule and case-mix adjustment prospectively.
Separate manufacturer-controlled measures from provider/payer-controlled process measures; use shared accountability where appropriate. [8]
Audit data independently where the payment consequence is material.
Predefine how evidence will trigger recalibration of price, eligibility, support or care-pathway design rather than treating the contract as static.
10. What manufacturers, payers and clinicians can do now
Table 8. Immediate actions by stakeholder
| Stakeholder | Do now | Do not wait for |
| DiGA manufacturer | Create the causal pathway map; add TNT/resource-use endpoints; pre-specify economic analyses; map value capture; propose contract-ready metrics | Price negotiation to discover that the economic dataset is missing |
| Sickness fund / payer | Ask for pathway-level evidence; distinguish cost savings from capacity; define performance metrics around attributable value | A usage metric alone to answer whether care improved |
| Clinician / provider | Measure onboarding, review and exception workload; define how capacity will be redeployed; remove parallel processes | A generic claim that “digital saves time” |
| HTA / policy researcher | Develop methods that join patient benefit, workflow, scarce capacity and budget impact without double counting | A single universal digital-health cost-effectiveness template |
11. A 90-day practical workplan for a DiGA company
For a manufacturer preparing German market access or a price/value discussion, this does not need to begin as a major academic programme. A focused 90-day workstream can establish whether the pathway-value hypothesis is plausible and what evidence must be generated next.
Table 9. A pragmatic 90-day pathway-value workplan
| Period | Work | Output | Decision gate |
| Days 1–30 | Comparator pathway map; stakeholder interviews; claims/resource hypothesis; TNT task inventory | Causal value map + economic data dictionary | Is there a credible pathway mechanism beyond clinical efficacy? |
| Days 31–60 | Pilot workflow/time measurement; utilisation baseline; data-access assessment; initial cost-consequence model | Early capacity/resource estimates + uncertainty map | Which value claims are measurable and attributable? |
| Days 61–90 | Budget-impact scenarios; performance metric design; RWE protocol; price/value narrative | Payer-ready evidence plan + model + contract metric proposal | What evidence should be generated before/after negotiation? |
12. The next frontier: reimbursing redesigned care, not merely digital products
Germany’s DiGA pathway solved a problem that many countries are still struggling with: it created a national route for eligible digital therapeutics to enter statutory reimbursement. The next problem is more demanding. Digital value is often produced by changing who does what, when, at what intensity, and with what information. That value can appear as health gain, access, released capacity, avoided expenditure, or more appropriate care, and those components do not necessarily accrue to the same actor. [7][8][9][15]
The 2026 reforms make performance more visible and put part of negotiated reimbursement at risk. That is an important evolution. But a genuinely value-based pathway will require something broader than measuring usage and outcomes inside the app. It will require evidence about what the app changes outside the app. [3][4][5]
| The question to take into the next DiGA negotiationIf this DiGA works as intended, which part of the care pathway changes, which scarce resource is released or consumed, where does that resource go, and which actor captures the resulting value? |
For manufacturers, the practical message is simple: do not wait until reimbursement negotiation to begin health economics. Build the pathway-value hypothesis into evidence generation from the start. The strongest DiGA dossier will not only show that patients improve. It will show, credibly and without overclaiming, how care changes when they do.
| Developing a DiGA (digital therapeutic) for Germany? Odelle Technology supports digital-health companies with reimbursement strategy, evidence design, health-economic modelling, payer value analysis and market-access planning across Germany and Europe . odelletechnology.com |
References
1. Sozialgesetzbuch (SGB V) §139e. Verzeichnis für digitale Gesundheitsanwendungen; positive Versorgungseffekte and application-accompanying success measurement. Current text accessed 29 September 2026. Link
2. Bundesinstitut für Arzneimittel und Medizinprodukte (BfArM). Das Fast-Track-Verfahren für digitale Gesundheitsanwendungen (DiGA) nach §139e SGB V. DiGA-Leitfaden, version 3.6, 10 December 2025. Link
3. Sozialgesetzbuch (SGB V) §134. Vereinbarung über Vergütungsbeträge digitaler Gesundheitsanwendungen; success-dependent price components and volume-related discounts. Current text accessed 29 September 2026. Link
4. Digitale Gesundheitsanwendungen-Verordnung (DiGAV), §§23a–23e. Application-accompanying success measurement: collection, usage, patient-reported health status and satisfaction. Current text accessed 29 September 2026. Link
5. BfArM. Digitale Gesundheitsanwendungen (DiGA): information on application-accompanying success measurement (AbEM), including data collection from 1 July 2026 and first reporting on 15 April 2027. Accessed 29 September 2026. Link
6. GKV-Spitzenverband. DiGA-Bericht 2025: Bericht über die Inanspruchnahme und Entwicklung der Versorgung mit Digitalen Gesundheitsanwendungen. Reporting period 1 September 2020–31 December 2025. Link
7. Gensorowsky D, Witte J, Batram M, Greiner W. Market access and value-based pricing of digital health applications in Germany. Cost Effectiveness and Resource Allocation. 2022;20:25. doi:10.1186/s12962-022-00359-y. Link
8. Benning L, Teepe GW, Pooth J-S, Hans FP. Performance-based reimbursement for digital therapeutics in Germany: A misconceptualized opportunity. Digital Health. 2024;10:20552076241281199. doi:10.1177/20552076241281199. Link
9. Freitag B, Fehring L, Uncovska M, Olsacher A, Meister S. Negotiating pricing and payment terms for insurance covered mHealth apps: a qualitative content analysis and taxonomy development based on a German experience. Health Economics Review. 2024;14:81. doi:10.1186/s13561-024-00558-8. Link
10. Cirkel L, Lechner F, Schlicker N, et al. Adoption and perception of prescribable digital health applications (DiGA) and the advancing digitalization among German internal medicine physicians: a cross-sectional survey study. BMC Health Services Research. 2024;24:1353. doi:10.1186/s12913-024-11807-1. Link
11. Kendziorra J, Seerig KH, Winkler TJ, Gewald H. From awareness to integration: a qualitative interview study on the impact of digital therapeutics on physicians’ practices in Germany. BMC Health Services Research. 2025;25:568. doi:10.1186/s12913-025-12656-2. Link
12. Mäder M, Timpel P, Schönfelder T, et al. Evidence requirements of permanently listed digital health applications (DiGA) and their implementation in the German DiGA directory: an analysis. BMC Health Services Research. 2023;23:369. doi:10.1186/s12913-023-09287-w. Link
13. Sippli K, Deckert S, Schmitt J, Scheibe M. Healthcare effects and evidence robustness of reimbursable digital health applications in Germany: a systematic review. npj Digital Medicine. 2025;8:495. doi:10.1038/s41746-025-01879-6. Link
14. Freitag B, Uncovska M, Meister S, Prinz C, Fehring L. Cost-effectiveness analysis of mHealth applications for depression in Germany using a Markov cohort simulation. npj Digital Medicine. 2024;7:321. doi:10.1038/s41746-024-01324-0. Link
15. Kidholm K, Johansson M, Poulsen MK. The case for updating health economic evaluation of digital technologies: in response to the demographic challenges. International Journal of Technology Assessment in Health Care. Published online 17 September 2026. doi:10.1017/S0266462326104139. Link
16. Kassenärztliche Bundesvereinigung (KBV). Digitale Gesundheitsanwendungen: prescribing, billing and remuneration. Current page accessed 29 September 2026. Link
17. Kassenärztliche Bundesvereinigung (KBV). Vergütung für neue DiGA im EBM geregelt. 26 March 2026. Link
18. Schmidt L, Pawlitzki M, Renard BY, Meuth SG, Masanneck L. The three-year evolution of Germany’s Digital Therapeutics reimbursement program and its path forward. npj Digital Medicine. 2024;7:139. doi:10.1038/s41746-024-01137-1. Link