
What reconstructed patient-level survival data can and cannot tell us
Odelle Technology | September 2026
| A Kaplan-Meier curve is not merely a picture. It contains enough structured information that, under the right conditions, analysts can reconstruct an approximation of the underlying time-to-event data. That can reopen analyses that otherwise look impossible. But reconstructing the observed past is not the same as predicting the unobserved future – and in health technology assessment, that distinction matters. |
A familiar problem in health technology assessment
A health economist opens a trial publication and finds a familiar problem. The paper reports a hazard ratio, a median survival time and a Kaplan-Meier curve, but the individual patient data are unavailable. The model, however, needs much more than a single summary statistic. It may need to test alternative survival distributions, examine non-proportional hazards, estimate restricted mean survival, build an indirect comparison or extrapolate outcomes over a lifetime horizon.
At first sight, the analyst has a graph rather than a dataset. Yet the Kaplan-Meier curve is itself a compressed mathematical representation of the underlying event and censoring process. The step pattern, the numbers remaining at risk and the timing of events all carry information. The question is whether enough of that information can be recovered to support credible secondary analysis.
That question has moved well beyond a methodological curiosity. The National Institute for Health and Care Excellence (NICE) now explicitly recognises reconstruction methods when patient-level survival data are unavailable, and reconstructed data have appeared in real technology appraisals. The technique is useful precisely because it sits at the awkward boundary between what has been published and what a payer still needs to know.
How a curve becomes approximate patient-level data
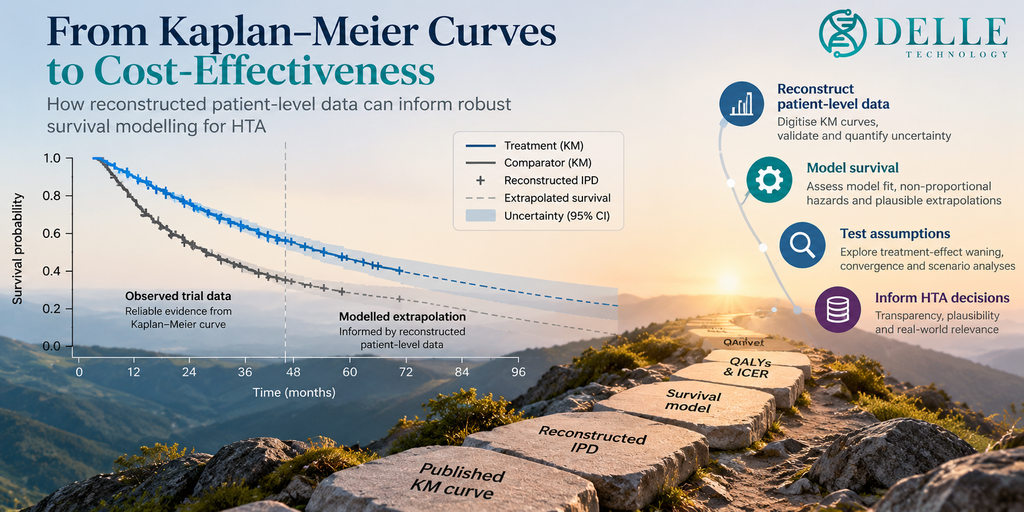
The methodological foundation is the work of Guyot, Ades, Ouwens and Welton. Their 2012 paper described an algorithm that digitises coordinates from a published Kaplan-Meier curve and then works backwards through the Kaplan-Meier equations. Where the publication also reports numbers at risk and the total number of events, those additional constraints improve the reconstruction. The output is not the original clinical-trial dataset. It is a pseudo-individual patient dataset that is numerically consistent, as closely as possible, with the published survival experience.
The idea was subsequently made more accessible. Wei and Royston implemented reconstruction in the ipdfc command for Stata. Liu, Zhou and Lee later developed IPDfromKM, an R package and web application that systematised curve preprocessing and reconstruction. In practical terms, these tools allow analysts to move from a handful of published summaries to a much richer representation of the observed time-to-event data.
The analytical chain is straightforward to describe, even if the implementation requires care:
| Stage | What it contributes |
| Published Kaplan-Meier curve | The visible survival trajectory and, ideally, a numbers-at-risk table |
| Digitisation | Extraction of coordinates from the published curve |
| Reconstruction | Approximation of event and censoring times consistent with the curve |
| Pseudo-IPD | A reconstructed patient-level time-to-event dataset |
| Survival modelling | Fitting alternative parametric or flexible survival functions |
| External validation | Testing whether extrapolated survival is clinically and empirically plausible |
| Economic model | Translation into life-years, quality-adjusted life years (QALYs), costs and the incremental cost-effectiveness ratio (ICER) |
Why health economists care
A reported median survival time and a hazard ratio are useful, but they are restrictive inputs for economic evaluation. Approximate patient-level survival data allow the analyst to fit and compare several survival models, inspect hazards over time, calculate restricted mean survival, test proportional-hazards assumptions and explore scenarios that would otherwise be inaccessible. These capabilities become particularly important in oncology, rare diseases and advanced therapies, where trials may be small, follow-up immature and long-term outcomes economically decisive.
This does not mean reconstructed data are automatically preferable to published aggregate evidence. Their value is conditional on the quality of the published curve and the information accompanying it. Guyot and colleagues found excellent accuracy for survival probabilities and medians, while hazard-ratio reconstruction was materially better when numbers at risk or total event counts were available. More recent validation has reinforced that message. A 2025 evaluation reconstructed data from 46 published Kaplan-Meier curves; across 58 reconstructed hazard ratios, the mean absolute percentage difference from the published estimate was 2.85% and the median difference was 2.14%, with most differences below 5%.
| Reconstruction can recover a surprisingly faithful approximation of the observed survival experience. It cannot recover information that was never published, and it cannot observe what has not yet happened. |
This is already part of real health technology assessment
The technique is not confined to academic demonstrations. NICE – the National Institute for Health and Care Excellence in England – states in its current health technology evaluation manual that when individual patient-level survival data are unavailable, methods such as Guyot et al. may be used to reconstruct Kaplan-Meier data. NICE also requires proportional-hazards assumptions to be assessed and asks for observed Kaplan-Meier and fitted parametric curves, together with numbers at risk, to be presented when survival modelling supports a cost-utility analysis.
Recent appraisals show what this looks like in practice. In NICE’s appraisal of sotatercept for pulmonary arterial hypertension, the company used the Guyot algorithm to reconstruct individual patient-level survival data from published Kaplan-Meier curves stratified by risk, and these reconstructed data informed mortality modelling. In the appraisal of cabozantinib for medullary thyroid cancer, published Kaplan-Meier curves were digitised and reconstructed because original patient-level data could not be supplied for intellectual-property reasons. These examples matter because they show reconstruction being used not merely when data were never collected, but also when relevant data exist yet are inaccessible to the analyst.
Peer-reviewed economic evaluations are also using the approach. Recent cost-effectiveness and comparative studies in cancer have reconstructed pseudo-IPD from published Kaplan-Meier curves to fit parametric survival functions, support indirect treatment comparisons and populate semi-Markov or partitioned-survival models. The practical implication is clear: reconstructed survival data are becoming part of the working toolkit of applied health economics, provided their provenance and limitations are transparent.
The crucial distinction: reconstruction is not extrapolation
This is where the analysis becomes more interesting – and where false confidence can enter. Reconstruction addresses the observed period. Health technology assessment usually asks about a much longer horizon. A payer may be deciding whether a technology is cost effective over ten years, twenty years or a lifetime, even though the trial followed patients for only two or three years.
Several survival models can reproduce the observed Kaplan-Meier curve reasonably well and still produce very different tails. Exponential, Weibull, Gompertz, log-normal, log-logistic, generalised gamma, spline-based and cure-type models embody different assumptions about how hazards evolve. Once extrapolated beyond observed follow-up, those assumptions can generate materially different life-years and QALYs. The economic model may therefore be far more sensitive to the choice of extrapolation than to small differences in how faithfully the observed curve was reconstructed.
The NICE Decision Support Unit has long emphasised that extrapolation should be judged not only by statistical fit to the observed trial but also by external plausibility. Clinical knowledge, external cohorts, registries, general-population mortality and other long-term data may all be relevant. Bullement and colleagues’ 2023 systematic review identified 18 methodological approaches across 22 studies for incorporating external evidence into trial-based survival extrapolation, including piecewise methods, Bayesian informative priors and general-population adjustments. Importantly, the review found no studies that directly compared the predictive performance of alternative external-evidence methods. The methodological choice therefore remains a substantive judgement, not a mechanical extension of curve fitting.
A useful hierarchy of confidence
| Level | Interpretation |
| Highest confidence | The observed and published Kaplan-Meier curve itself, subject to the usual limitations of the underlying trial. |
| Reasonable confidence when reconstruction is well supported | Pseudo-IPD that closely reproduce the observed curve, especially when numbers at risk and event totals are available. |
| More uncertainty | Comparative estimates derived from reconstructed data, particularly where proportional-hazards assumptions fail or indirect comparisons require additional adjustment. |
| Greatest uncertainty | Survival beyond the observed follow-up period, where model structure, treatment-effect waning and external evidence dominate the result. |
What reconstructed data cannot give back
There is a simple discipline that prevents over-interpretation: never confuse reconstructed event times with reconstructed patients. A Kaplan-Meier curve does not contain age, performance status, disease stage, biomarker status, treatment switching, adverse events or other covariates unless those variables are represented in the published stratification itself. No algorithm can recover clinical attributes that were never encoded in the curve.
This becomes particularly important when analysts want to move from descriptive reconstruction to adjusted indirect comparisons or subgroup modelling. The pseudo-IPD may support time-to-event analysis, but it cannot recreate individual-level treatment-effect modifiers that were withheld or never published. A reconstructed dataset can therefore expand the feasible analysis while still leaving important structural uncertainty intact.
Restricted mean survival time and non-proportional hazards
Reconstructed individual patient data are especially useful when the proportional-hazards assumption is doubtful. In oncology and immuno-oncology, delayed treatment effects, crossing survival curves and changing hazards can make a single hazard ratio an incomplete summary of benefit. Restricted mean survival time (RMST) offers a different perspective: rather than assuming a constant relative hazard, it measures the average event-free or survival time accumulated up to a prespecified horizon.
This is not merely a theoretical advantage. Everest and colleagues validated RMST estimates derived from reconstructed Kaplan-Meier data against the original individual patient data from 39 Canadian Cancer Trials Group studies. For overall survival, the mean percentage bias was below 1% in both treatment arms, with very small absolute error. In other words, when the published curve is adequate, reconstructed data can support an RMST analysis with striking fidelity to the original trial dataset.
Recent work also suggests that RMST-based summaries may be more stable than hazard ratios as oncology trials mature, particularly when hazards are non-proportional. That matters because reconstructed patient-level data give analysts access to estimands that are often impossible to calculate from a single published hazard ratio alone. The practical lesson is not that RMST should replace the hazard ratio, but that the two answer different questions and can be informative side by side.
What health technology assessment agencies actually look for
The statistical reconstruction is only the first step. Health technology assessment agencies are usually much more interested in whether the resulting survival model is clinically plausible, transparent and decision-relevant than in whether a particular algorithm has reproduced the published curve to several decimal places.
In England, the National Institute for Health and Care Excellence (NICE) explicitly allows reconstruction of individual-level survival information when the original patient data are unavailable. But NICE separately expects analysts to examine proportional hazards, compare plausible survival distributions, show the observed and modelled curves, justify long-term extrapolation and test whether predictions are clinically credible. A successful reconstruction therefore does not validate the tail of the model; it only gives the analyst a more useful representation of the observed period.
Australia’s Pharmaceutical Benefits Advisory Committee (PBAC) is particularly explicit about the mechanics of extrapolation. Its submission guidance advises using observed time-to-event data until the point at which they become unreliable because too few patients remain at risk, then justifying the point at which extrapolation begins. It recommends fitting several parametric models, assessing visual fit and information criteria, testing alternative truncation points and examining whether the extrapolated treatment effect remains clinically plausible. If an independently extrapolated treatment advantage continues or grows when that is not credible, the guidance asks analysts to consider convergence or treatment-effect waning.
The French Haute Autorite de Sante (HAS) provides an instructive example of why clinical plausibility matters. In its economic assessment of Optune, the Commission for Economic and Public Health Evaluation criticised a survival extrapolation that produced a plateau implying possible remission. The problem was not that a plateau was mathematically impossible; it was that the clinical evidence did not adequately justify it and the modelling choice materially influenced the result. A smooth tail can still be the wrong tail.
Germany presents a different emphasis. The Gemeinsamer Bundesausschuss (G-BA), the Federal Joint Committee, is less centred on cost-per-quality-adjusted-life-year modelling and more concerned with the quality, applicability and patient relevance of the underlying evidence. Its methods stress systematic evidence assessment, patient-relevant outcomes, methodological quality and transferability to real-world care. Reconstructed survival data may therefore help analysts interrogate published evidence, but they do not upgrade the design quality of the original studies or remove uncertainty about applicability.
Where the uncertainty really sits
One of the most useful disciplines in survival modelling is to separate three sources of uncertainty: digitisation, reconstruction and extrapolation. In many health technology assessments, the first two are not the dominant problem. The much larger uncertainty comes from asking immature data to describe a long future.
Everest and colleagues tested this directly in 32 randomised oncology trials by fitting parametric models to early Kaplan-Meier data and comparing the projected survival with later observed follow-up. The mean absolute error for projected overall-survival restricted mean survival time was 3.18 months, and error increased as the extrapolation horizon lengthened and censoring increased. A simulation study by Beca and colleagues reached a related conclusion: small samples and short follow-up can produce large errors in lifetime survival estimates even when the correct parametric distribution is known. Statistical fit is therefore not the same thing as predictive truth.
A useful hierarchy is consequently: digitisation error, then reconstruction uncertainty, then extrapolation uncertainty. That ordering will not hold in every dataset, but it is a helpful reminder that a beautifully reconstructed Kaplan-Meier curve can still feed a highly uncertain lifetime model.
Reconstruction does not solve comparability
Once a published curve has been converted into pseudo-individual patient data, it becomes technically possible to calculate restricted mean survival time, refit survival distributions and perform indirect comparisons across studies. The patient-level appearance of the reconstructed dataset can, however, create a false sense of comparability.
Differences in eligibility criteria, disease severity, subsequent therapy, follow-up, trial era, supportive care and prognostic mix remain. Reconstructing individual event times does not reconstruct randomisation between trials, and it cannot recreate unreported baseline covariates. The method can make an analysis possible; it cannot make a non-randomised comparison causal simply by making the data look granular.
Three questions that expose a fragile survival model
A few simple questions can reveal more than pages of fit statistics. First: how much of the incremental quality-adjusted life-year gain occurs after the point at which the trial contains little reliable observed survival information? If most of the benefit appears in the unobserved tail, the economic result is primarily a modelling result rather than an observed one.
Second: would the cost-effectiveness conclusion survive if the treatment effect began to wane immediately after the observed period, or if the intervention and comparator hazards gradually converged? This is particularly important when treatment stops but the model assumes a persistent survival advantage.
Third: does the model predict anything clinically strange? Examples include survival better than the age-matched general population without a defensible explanation, hazards that fall implausibly with age, an unsupported cure plateau, or a permanent treatment effect after treatment cessation. These checks are simple, but they force the extrapolation back into clinical reality.
What good practice should look like
If reconstructed survival data materially influence an economic evaluation, the process should be auditable. At minimum, analysts should report the source Kaplan-Meier figure, the digitisation method, whether numbers at risk and total events were available, the reconstruction algorithm, validation against published medians or hazard ratios, assumptions about censoring, the survival distributions considered, the rationale for the selected extrapolation and any external evidence used to test long-term plausibility.
Sensitivity analysis is particularly important. If the incremental cost-effectiveness ratio changes materially when a different plausible survival distribution is used, the uncertainty belongs in the decision problem rather than being hidden behind a single preferred curve. The objective is not to manufacture precision from a graph. It is to recover useful information transparently and then be explicit about where modelling judgement begins.
Where the field is going
The next development is automation. Recent research is exploring systems that combine image processing and machine learning to identify axes, risk tables and survival trajectories automatically before reconstructing synthetic patient-level data. That could make large-scale extraction across systematic reviews far quicker. The methodological challenge, however, will remain the same: automation must preserve traceability. An analyst – and eventually a payer – must still be able to see what was extracted, what was assumed and how closely the reconstructed curve reproduces the source.
The interesting future question is therefore not whether artificial intelligence can digitise Kaplan-Meier curves. It almost certainly can. The question is whether automated reconstruction can be made reproducible, validated and sufficiently transparent for evidence synthesis and reimbursement decisions.
The health economist’s conclusion
A Kaplan-Meier curve may contain far more usable information than its appearance suggests. Reconstruction methods can reopen analyses that would otherwise be impossible, and their use is now recognised in formal health technology assessment methodology and visible in real appraisals.
But reconstructed individual patient data do not eliminate uncertainty. They move it. Once the observed survival experience has been approximately recovered, the difficult question becomes what happens beyond it. That is where extrapolation assumptions, external evidence, clinical judgement and model structure begin to determine value.
For health economists, the most important distinction is therefore a simple one: reconstructed IPD can recover much of what happened to the trial population. It cannot recover what was never published, and it certainly cannot observe what has not yet happened. In health technology assessment, the unseen part of the survival curve may ultimately matter more than the part printed in the paper.
A practical starting point
This article was prompted by Xin (David) Zhao’s practical walkthrough, which shows how published Kaplan-Meier curves can be digitised and reconstructed in R. It is a useful applied introduction to the workflow before moving into the methodological literature and health technology assessment guidance: Reconstructing Individual Patient Data from Published Kaplan-Meier Curves in R
References
1. Guyot P, Ades AE, Ouwens MJNM, Welton NJ. Enhanced secondary analysis of survival data: reconstructing the data from published Kaplan-Meier survival curves. BMC Medical Research Methodology. 2012;12:9. Link
2. Wei Y, Royston P. Reconstructing time-to-event data from published Kaplan-Meier curves. The Stata Journal. 2017;17(4):786-802. Link
3. Liu N, Zhou Y, Lee JJ. IPDfromKM: reconstruct individual patient data from published Kaplan-Meier survival curves. BMC Medical Research Methodology. 2021;21:111. Link
4. Chalise P, et al. Reconstructing patient level survival data from published Kaplan-Meier curves. 2025. Link
5. National Institute for Health and Care Excellence. NICE health technology evaluations: the manual – Economic evaluation. Section 4.6.21-4.6.23. Link
6. Latimer NR. NICE Decision Support Unit Technical Support Document 14: Survival analysis for economic evaluations alongside clinical trials – extrapolation with patient-level data. Link
7. Bullement A, Stevenson MD, Baio G, Shields GE, Latimer NR. A systematic review of methods to incorporate external evidence into trial-based survival extrapolations for health technology assessment. Medical Decision Making. 2023;43(5):610-620. Link
8. National Institute for Health and Care Excellence. Sotatercept for treating pulmonary arterial hypertension: committee papers. Link
9. National Institute for Health and Care Excellence. Cabozantinib for treating medullary thyroid cancer: committee papers and final appraisal documentation. Link
10. Zhao X (David). Reconstructing Individual Patient Data from Published Kaplan-Meier Curves in R. EpiBiome Analytics. 29 July 2026. Link
11. Everest L, Blommaert S, Tu D, et al. Validating Restricted Mean Survival Time Estimates From Reconstructed Kaplan-Meier Data Against Original Trial Individual Patient Data From Trials Conducted by the Canadian Cancer Trials Group. Value in Health. 2022;25(7):1157-1164. https://doi.org/10.1016/j.jval.2021.12.004
12. Everest L, Blommaert S, Chu RW, Chan KKW, Parmar A. Parametric Survival Extrapolation of Early Survival Data in Economic Analyses: A Comparison of Projected Versus Observed Updated Survival. Value in Health. 2022;25(4):622-629. https://doi.org/10.1016/j.jval.2021.10.004
13. Beca JM, Chan KKW, Naimark DMJ, Pechlivanoglou P. Impact of limited sample size and follow-up on single event survival extrapolation for health technology assessment: a simulation study. BMC Medical Research Methodology. 2021;21:282. https://doi.org/10.1186/s12874-021-01468-7
14. Pharmaceutical Benefits Advisory Committee. Guidelines for preparing a submission to the Pharmaceutical Benefits Advisory Committee, Version 5.0. https://pbac.pbs.gov.au/content/information/files/pbac-guidelines-version-5.pdf
15. Haute Autorite de Sante. OPTUNE – Commission for Economic and Public Health Evaluation, economic assessment transcript, 13 April 2021. https://www.has-sante.fr/jcms/p_3276107/fr/optune-20210413-avis-eco-transcription-ceesp
16. Gemeinsamer Bundesausschuss (Federal Joint Committee). Basis of assessment: evidence-based medicine. https://www.g-ba.de/english/responsibilities-methods/assessment/
17. Estimating overall survival treatment effects in oncology trials: hazard ratio instability and restricted mean survival time as a robust, internally predictive complement. PubMed record, 2026. https://pubmed.ncbi.nlm.nih.gov/42537856/